
In today’s rapidly evolving digital landscape, the ability to swiftly develop and showcase a data-driven application is paramount for businesses seeking to gain insights, make informed decisions, and stay ahead of the curve. When there is limited time and resources to prototype an idea as a proof of concept, low-code frameworks like Dash are quite popular. The cool thing about it is you don’t have to know about the nifty details related to frontend technologies from the development perspective. Nevertheless, if you have some experience with HTML, CSS, and JavaScript then it’s better as you can create custom layouts and play around with aesthetics. No need to worry about it if you don’t have any idea then working with whatever Dash provides out of the box will help you to get from point A to B (idea to prototype). You can easily create both the frontend and backend components using just one programming language of your choice.
At its core, Dash is built on top of Flask, which handles the web server backend, React.js for the front end, and Plotly for visualization needs. Dash provides the wrapper for these libraries which eases our development experience. Currently, it supports Python, R, and Julia, popular languages in the data science community. Furthermore, when using any one of the mentioned languages, popular packages for data processing, manipulation, and machine learning from the respective languages can be seamlessly integrated within the app.
In this post, I’ll be referencing Python as the main language for developing a low-code Dash app – arguably one of the most popular programming languages for data science at least for now. Hope this article will give some idea of the benefits of a low-code framework like Dash.
The Advantages of Low-Code Data Apps
The popularity of low-code development platforms has made it easier for people with different levels of technical skills to create sophisticated applications without needing to write a lot of code. Low-code data apps built with Dash offer several key advantages:

Rapid Development: Dash’s declarative approach with intuitive syntax allows developers to quickly prototype and iterate on application design with reuse components that significantly reduce development time and effort.
Customization and Flexibility: Dash provides extensive customization options, allowing developers to tailor the user interface, layout, and behavior of their applications to meet specific requirements.
Interactive Data Visualization: With Plotly integration, Dash enables developers to create dynamic, interactive data visualizations that empower users to explore and analyze complex datasets with ease.
Scalability and Performance: Dash applications are built for scalability and performance, with built-in support for asynchronous updates using callbacks (clientside callbacks, background callbacks), caching, and partial property updates, ensuring optimal performance even with large datasets and concurrent users.
Data integration from different data sources: Most of the popular databases like MySQL, Postgres, Amazon RedShift, Redis, MongoDB, Databricks, Snowflake, Google BigQuery, and Azure SQL can be integrated with the Dash app through the vendor-specific Python connector library.

Building Low-code Data Apps with Dash
Creating a data app with Dash typically involves the following steps:
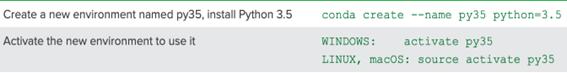
Setting up development environment: Developers can create separate development environments for managing the conflict arising from different dependencies. You can create a Python virtual environment using any of the tools like conda, virtualenv, or venv and install the required dependencies for the project. Below is the example using conda:
Then you can install the minimal dependencies for the basic setup of Data Analytics and Machine Learning apps as below:
– pip install dash # core dash backend
– pip install dash-renderer # dash front-end
– pip install dash-html-components # HTML components
– pip install dash-core-components # supercharged components
– pip install plotly # Plotly graphing library
– pip install pandas numpy # data manipulation libraries
– pip install scikit-learn # machine learning libraries
Note: First, you need to install one of the package management tools before you start creating the environment and installing the dependencies.
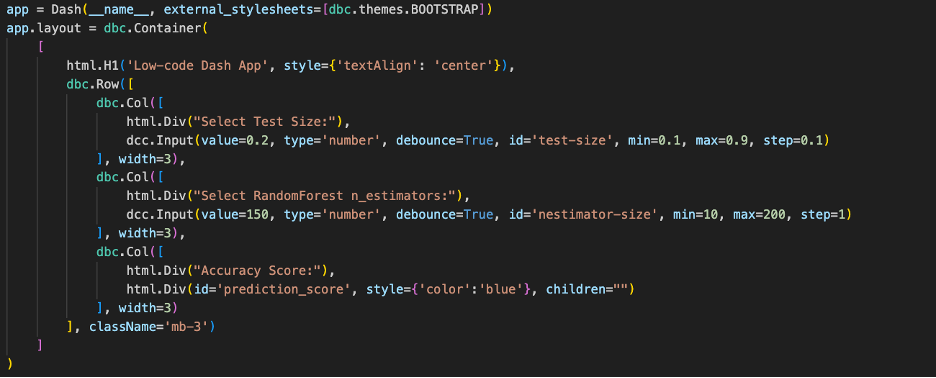
Defining Layout and Components: Based on the project’s needs developers can design the app layout and structure using Dash’s declarative syntax, specifying components such as graphs, tables, dropdowns, and sliders. You can see the code snippet of the layout containing different HTML tags as components.
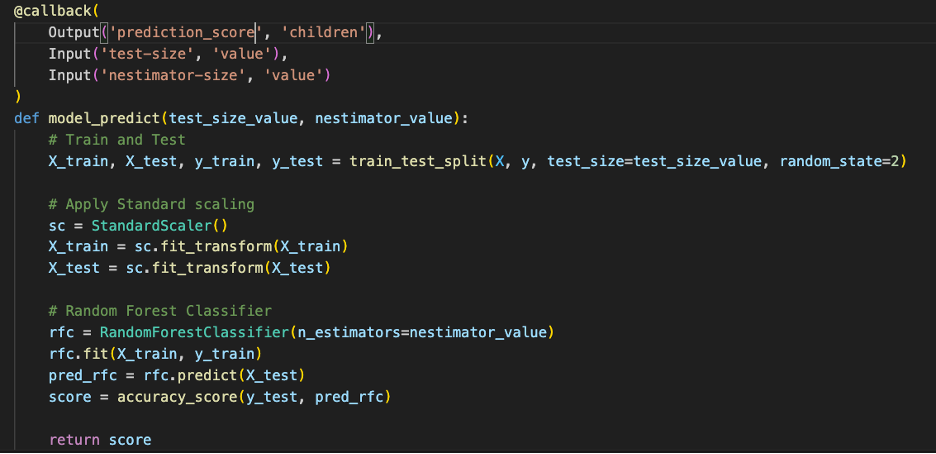
Binding Components to Callbacks: For the interactivity and behavior of the app based on the user input or data changes developers can define the callback functions. Callbacks enable dynamic updates and interactions between different components of the application. For example, you can use callbacks to load the saved machine-learning models to get predictions based on the user inputs or even train the model on the fly and get the prediction like below for small datasets as shown in the code snippet below.
Integrating Data and Visualizations: Developers can leverage Python libraries like pandas, numpy, and plotly to load, manipulate, and visualize data within the application. Additionally, you can integrate machine learning packages like scikit-learn for implementing predictive analytics within the application.
Deployment and Hosting: As the Dash framework and additional libraries required can be installed using a package installer for Python like pip or conda, you can easily bundle up the app in a docker container and deploy or do the installation and setup in any compute resource of a cloud environment such as Heroku, AWS, GCP or Microsoft Azure. And you don’t need to worry about setting up the server for the application. Furthermore, if your application is lightweight and doesn’t have privacy concerns related to the data being used, you can easily deploy and host freely on platforms like Python Anywhere.
Dash app examples:
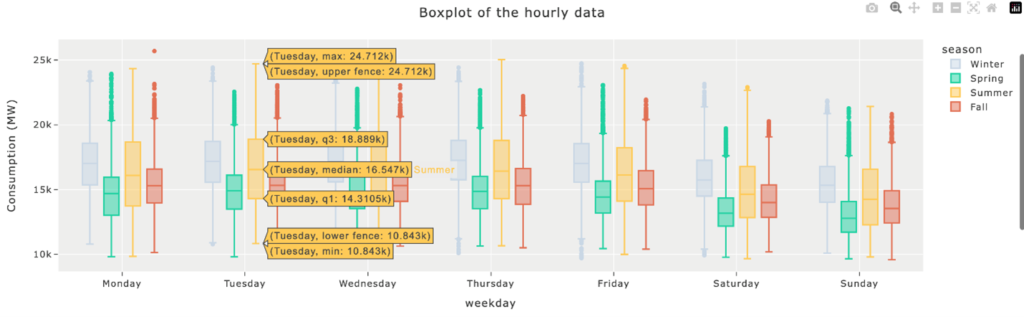
The first use case demonstrates the effectiveness of data manipulation using the Python data analysis library, pandas. For trend analysis, it showcases hourly energy consumption grouped by season throughout the weekdays. Moreover, hovering over the boxplot graph allows users to observe the data spread.
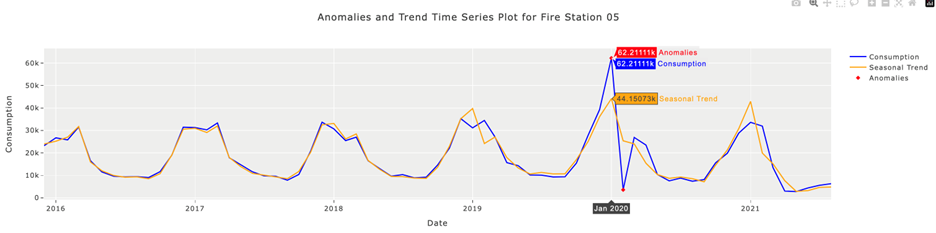
The second use case illustrates the utilization of Python’s statistical model library for implementing anomaly detection and trend analysis for time series data, as shown in the accompanying figure. Leveraging the built-in functionality of Plotly, users can hover over data points to view their corresponding values and labels for specific dates.
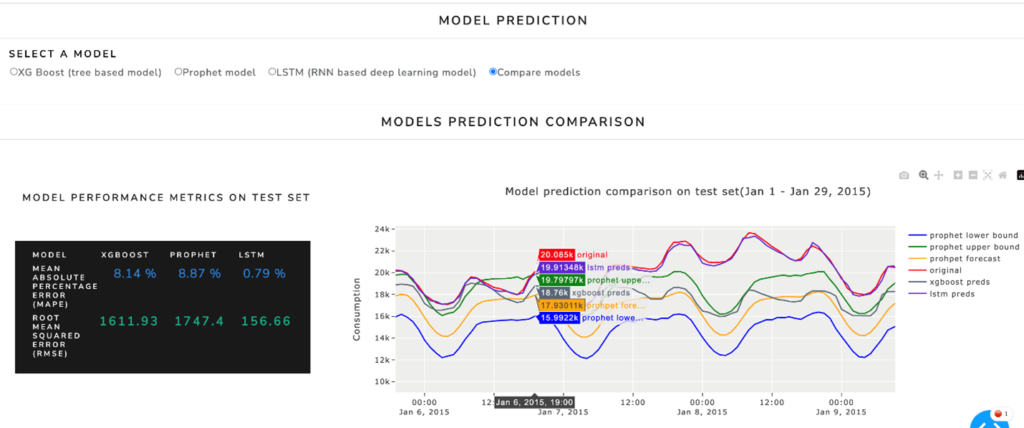
The final example demonstrates a comparison of multiple machine learning models to assess their performance on time series data. The models include XG Boost (a tree-based model), Prophet (a meta open-source model), and LSTM (a deep learning model based on recurrent neural networks).
Industry-specific use-cases:
Now that we have gone through the specifics of the implementation details I would like to highlight some industry-specific examples where low-code app frameworks like Dash could prove advantageous, particularly for Advanced Analytics with Machine Learning and Artificial Intelligence, with limited time and resources.
Supply Chain: Inventory Optimization
With Dash, you can prototype interactive dashboards to visualize crucial inventory metrics through intuitive graphs and charts, providing insights into stock levels and anticipated sales trends. Furthermore, by leveraging a trained machine learning model on historical sales data and other pertinent factors like seasonality, and market trends, you can show the predicted future demand trends with graphs using Dash.
Agriculture: Precision Agriculture
Using Dash, you can prototype interactive dashboards to visualize live data collected from IoT devices deployed across your fields in precision agriculture. You can monitor soil moisture, temperature, crop growth, and pest activity, all in one place. By leveraging these insights, you can make informed decisions about irrigation, fertilization, and pest control, optimizing resource usage and maximizing productivity. Dash empowers you to drive sustainable and profitable agricultural practices by visualizing data from IoT devices, helping you make the most of your farm’s potential.
Real Estate: Building Energy Consumption
With Dash, you can create interactive dashboards that visualize real-time data related to energy usage, HVAC performance, indoor air quality, and environmental conditions within buildings by integrating IoT sensors and smart meters data. The interactive features of Dash dashboards empower user to analyze historical data, identify abnormal conditions, and make data-driven decisions to enhance energy efficiency and occupant comfort. Graphs like line graphs, bar charts, pie charts, and scatter plots can be incorporated into the dashboard to visualize trends, compare data points, and present insights effectively.
In today’s fast-paced digital world, developers face the challenge of creating data-driven applications quickly to test proof of concept. Low-code frameworks like Dash have gained popularity because they empower individuals with varying technical backgrounds to develop applications, from simple to complex, with minimal coding. Dash offers numerous benefits, including rapid development, customization options, interactive data visualization, and scalability. By leveraging Dash’s intuitive syntax and integration with Plotly and other libraries for data manipulation and machine learning models, developers can efficiently prototype and iterate on application designs. Additionally, Dash enables developers to write code in a single language, streamlining the development process. Overall, Dash simplifies application development, enabling businesses to transform ideas into functional prototypes swiftly and driving innovation in today’s data-driven landscape.
Finally, I want to stress the importance of using a low-code data framework when resources like time, money, and people are limited. It’s a testament to the concept that necessity breeds innovation, especially when faced with limitations.
Author: Sarbottam Magar Thapa